


In this section, we delve into the comprehensive process of deploying Grafana within an AWS EC2 instance. Grafana stands as an essential data visualization and monitoring tool, pivotal for interpreting and managing diverse datasets. Our guide offers a step-by-step walkthrough, allowing users to harness the potential of Grafana’s user-friendly interface for creating insightful dashboards and analyzing metrics effectively.
1. Setup Grafana in your AWS EC2 Instance
- Go to the AWS console and Launch an EC2 instance for Grafana.

- Once the instance is launched, you can SSH into the instance.

- To install the required packages and download the Grafana repository signing key, run the following commands: Know More about Grafana Installation
COPY
sudo apt-get install -y apt-transport-https
  sudo apt-get install -y software-properties-common wget
sudo mkdir -p /etc/apt/keyrings/
wget -q -O - https://apt.grafana.com/gpg.key | gpg --dearmor | sudo tee /etc/apt/keyrings/grafana.gpg > /dev/null

- To add a repository for stable releases, run the following command:
COPY
echo "deb [signed-by=/etc/apt/keyrings/grafana.gpg] https://apt.grafana.com stable main" | sudo tee -a /etc/apt/sources.list.d/grafana.list

- To add a repository for beta releases, run the following command:
COPY
echo "deb [signed-by=/etc/apt/keyrings/grafana.gpg] https://apt.grafana.com beta main" | sudo tee -a /etc/apt/sources.list.d/grafana.list

- Run the following command to update the list of available packages:
COPY
sudo apt-get update

- To install Grafana OSS, run the following command:
COPY
sudo apt-get install grafana

- Start and Enable the grafana-server
COPY
#Start Grafana-Server
  sudo systemctl start grafana-server
  #Enable the Grafana-Server
  sudo systemctl enable grafana-server  #Check the status of grafana
  sudo systemctl status grafana-server

- Open port 3000 in your EC2 instance’s security group to allow external access to Grafana.

- Once the port is enabled you can access the Grafana Dashboard by using a public IPv4 address followed by Grafana port 3000.
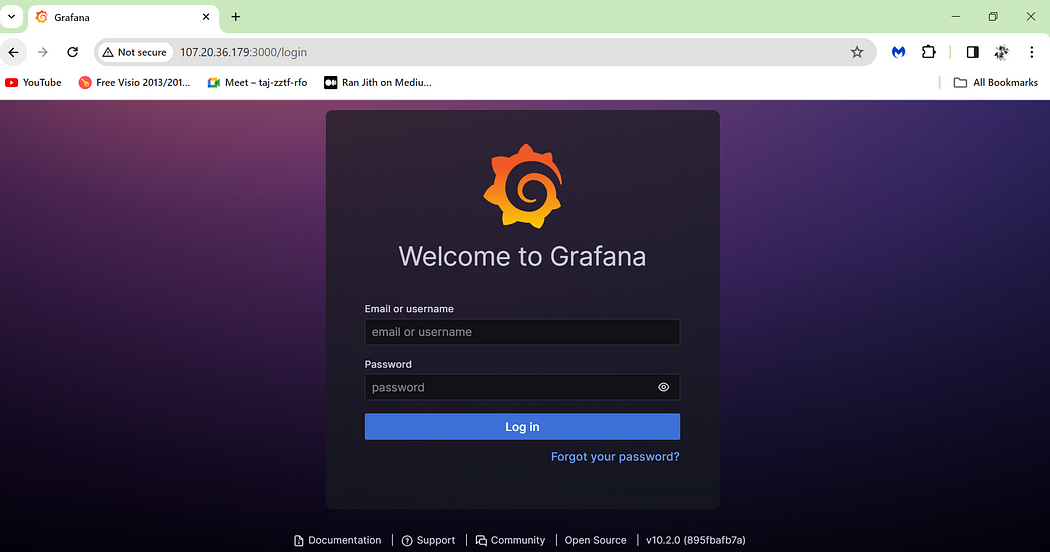
By default, Grafana credentials are username=admin and password=admin. Using this password change prompt will come.
Change the password, you will be logged into Grafana Dashboard

- As the password has been changed you are now Logged In to Grafan HomePage.

Thank you for exploring the deployment process of Grafana on an AWS EC2 instance with us. Grafana’s significance in data visualization and monitoring is immense, and our guide provides a step-by-step approach for leveraging its user-friendly interface to create insightful dashboards and effectively analyze metrics.